
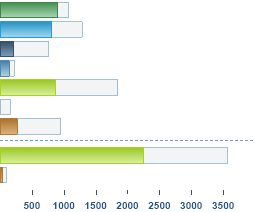
What is Current Generation?
This chart shows the generation by fuel type, but separates South Island wind and hydro. By displaying the country's generation in this way it is easy to see how much of each generation type is contributing against the generation capacity.
MW values are derived from the Transpower SCADA system and represent a single snapshot of the demand every 30 minutes.
Note: The timestamp shown indicates the end of the trading period that this data relates to.
What is Inter Island Flow?
Electricity is passed between the North and South Islands via the HVDC. The HVDC runs between Benmore in the South Island, and Haywards in the North Island. Electricity flow direction and volume changes depending on generation available and level of demand in each island.
MW values shown here are derived from the Transpower SCADA system.
Note: The timestamp shown indicates the end of the trading period that this data relates to.
What is Regional Price?
The Regional Price is a load weighted average for the previous half hour and indicates how prices differ across New Zealand, depending on market conditions.
Please note that these are indicative and not actual market settlement prices.
Note: The timestamp shown indicates the end of the trading period that this data relates to.
- $48.14
- $47.62
- $47.01
- $45.02
- $44.90
- $40.22
- $41.27
- $37.84
- $38.17
- $38.65
- $35.95
- $35.08
- $32.15
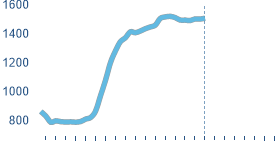
What is Today's Demand?
The solid line depicts the regional demand for the current day, as compared to the background band which shows the min/max range for the previous 5 weekdays.
MW values displayed in this window are derived from the Transpower SCADA system and represent a single snapshot of the demand every 30 minutes.
Note: The timestamp shown indicates the end of the trading period that this data relates to.

What is Today's Price?
This view of Prices is designed to give an indication of how prices differ between regions at different times of the day, subject to market conditions.
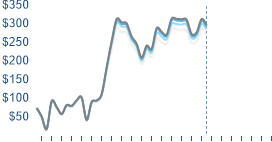

This information can be viewed online at www.em6live.co.nz