
What are Reserves?
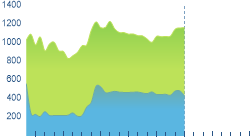
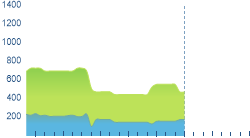
The Reserves (MW) chart compares the total reserve energy offered with the total reserve energy cleared. The reserves market provides a contingency source of energy for each island, i.e. both generation and interruptible load.
Note: The timestamp shown indicates the end of the trading period that the reserve data relates to.
What are Constraints?
The Constraints map view is a geographical representation of regions where electricity lines and circuits are approaching maximum capacity. Where a line or circuit spans more than one region, only one region (the inflow region) is highlighted.
Note: Constraint information for this page is updated every 5 minutes. The timestamp shown indicates the end of the trading period that the price and constraint data relates to.
- $58.10
- $57.81
- $58.75
- $57.13
- $57.31
- $59.38
- $59.47
- $60.80
- $69.01
- $70.67
- $64.66
- $62.79
- $65.47
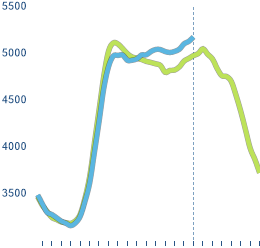
What is Total NZ Demand?
The Total NZ Demand (MW) graph tracks the total New Zealand demand for today compared with the corresponding demand at the same time (i.e. day of the week) last year. Demand generally peaks in the morning and again in the evening based on normal load patterns.
Note: The timestamp shown indicates the end of the trading period that the demand data relates to.

This information can be viewed online at www.em6live.co.nz